LiDAR Module Concepts
Overview
Sidebar
What is a LiDAR?
A LiDAR–Light Detection And Ranging–sensor measures the depth of objects in space. While there are a couple of possible operating principals, our sensor uses the time of flight (ToF) principal to determine distance from objects. It fires a laser to a target and analyzes the reflected light in order to create high-resolution maps. This capability makes LiDARs some of the best sensors for object detection, widely used throughout the field of autonomous vehicles.
The main output of a LiDAR sensor is a 2d/3d point cloud representation of the environment. A point cloud is a discrete set of points in space. Each point represents the distance from the sensor to an object in the environment.
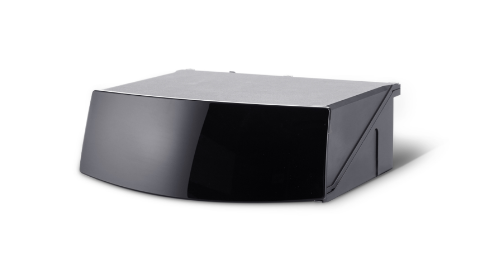
HESAI AT128 Hybrid Solid State LiDAR used on 24a
Goal of the LiDAR Module
The LiDAR Module aims to apply spatial information from LiDAR point clouds and process it into a set of points that represent the center of cones on the track in front of us.
Info
We use ROS2 to implement our pipeline. See Software Architecture for more information about how we use ROS2.
To avoid overhead from publishing the entire LiDAR point cloud to a ROS topic, lidar_module code is integrated directly into the ROS driver available with our LiDAR.
Input: pointcloud from the LiDAR. Not usually available to the ROS system unless specifically turned on.
All internal to the HESAI ROS Driver 2.0 Node
Output: a set of cone centroids. It is a message type from our custom ROS2 interfaces package.
/cpp_conesinterfaces::msg::PPMConeArray
Algorithm
To get to the output goal of a set of cone centroids, several pieces of extraneous data must be removed.
Remove ground: most of the points in the cloud come from the ground and must be removed so that we can effectively cluster in steps 2 and 3
Identify clusters which each represent a cone
Remove extraneous clusters (could represent buildings, rails, etc…) to have a final set of cone centroids
The LiDAR Module employs two main algorithms to carry out these steps.
Grace and Conrad–a ground filtering algorithm
DBSCAN–a clustering algorithm

Algorithm diagram
Ground Filtering
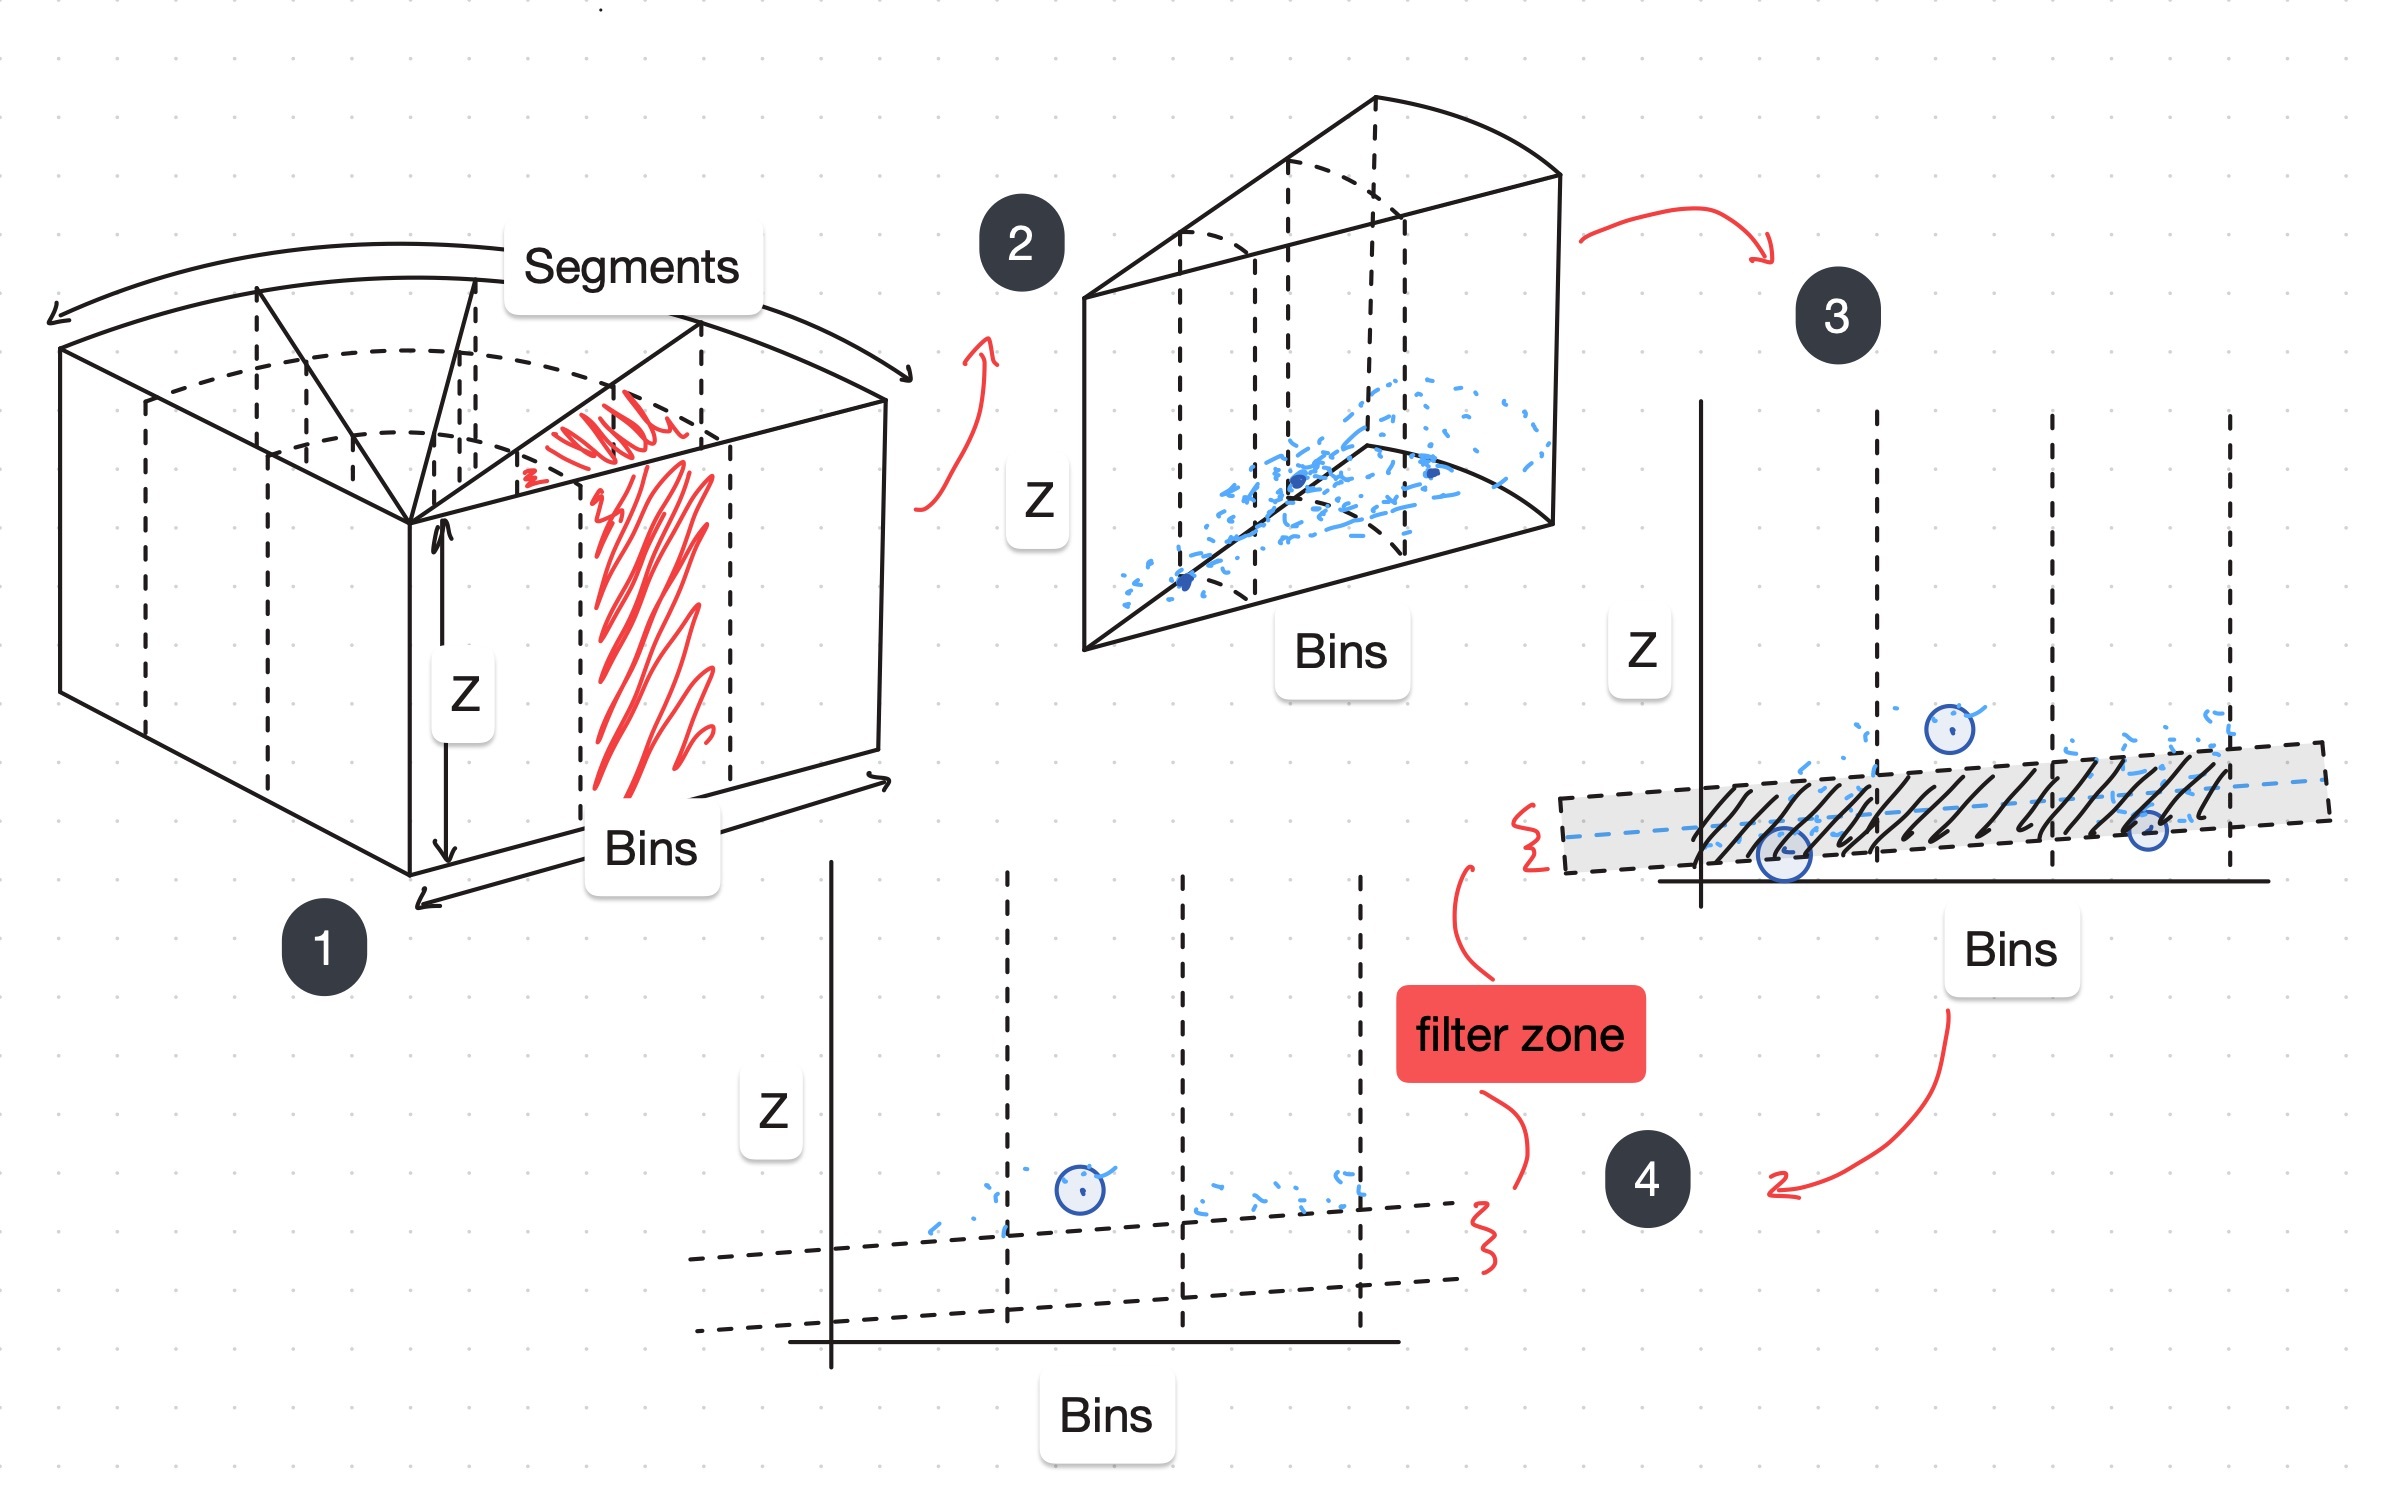
Diagram description of Grace and Conrad
We use a ground filtering algorithm called Grace and Conrad (named in our codebase after CMR alumni Grace and Conrad, who wrote the initial version).
convert point cloud to radius azimuth coordinates

for each segment do:
    for each bin do:
        find the point with the minimum height

    fit a line to those points (linear regression in r-z plane)

    filter out all points within a height threshold of the regression
Notes
Grace And Conrad makes the assumption that the ground is relatively planar
Clustering
Density-Based Spatial Clustering of Applications with Noise (DBSCAN) is used to identify clusters of points. The basic algorithm is below and a more detailed pseudocode can be found in the DBSCAN Wikipedia article.
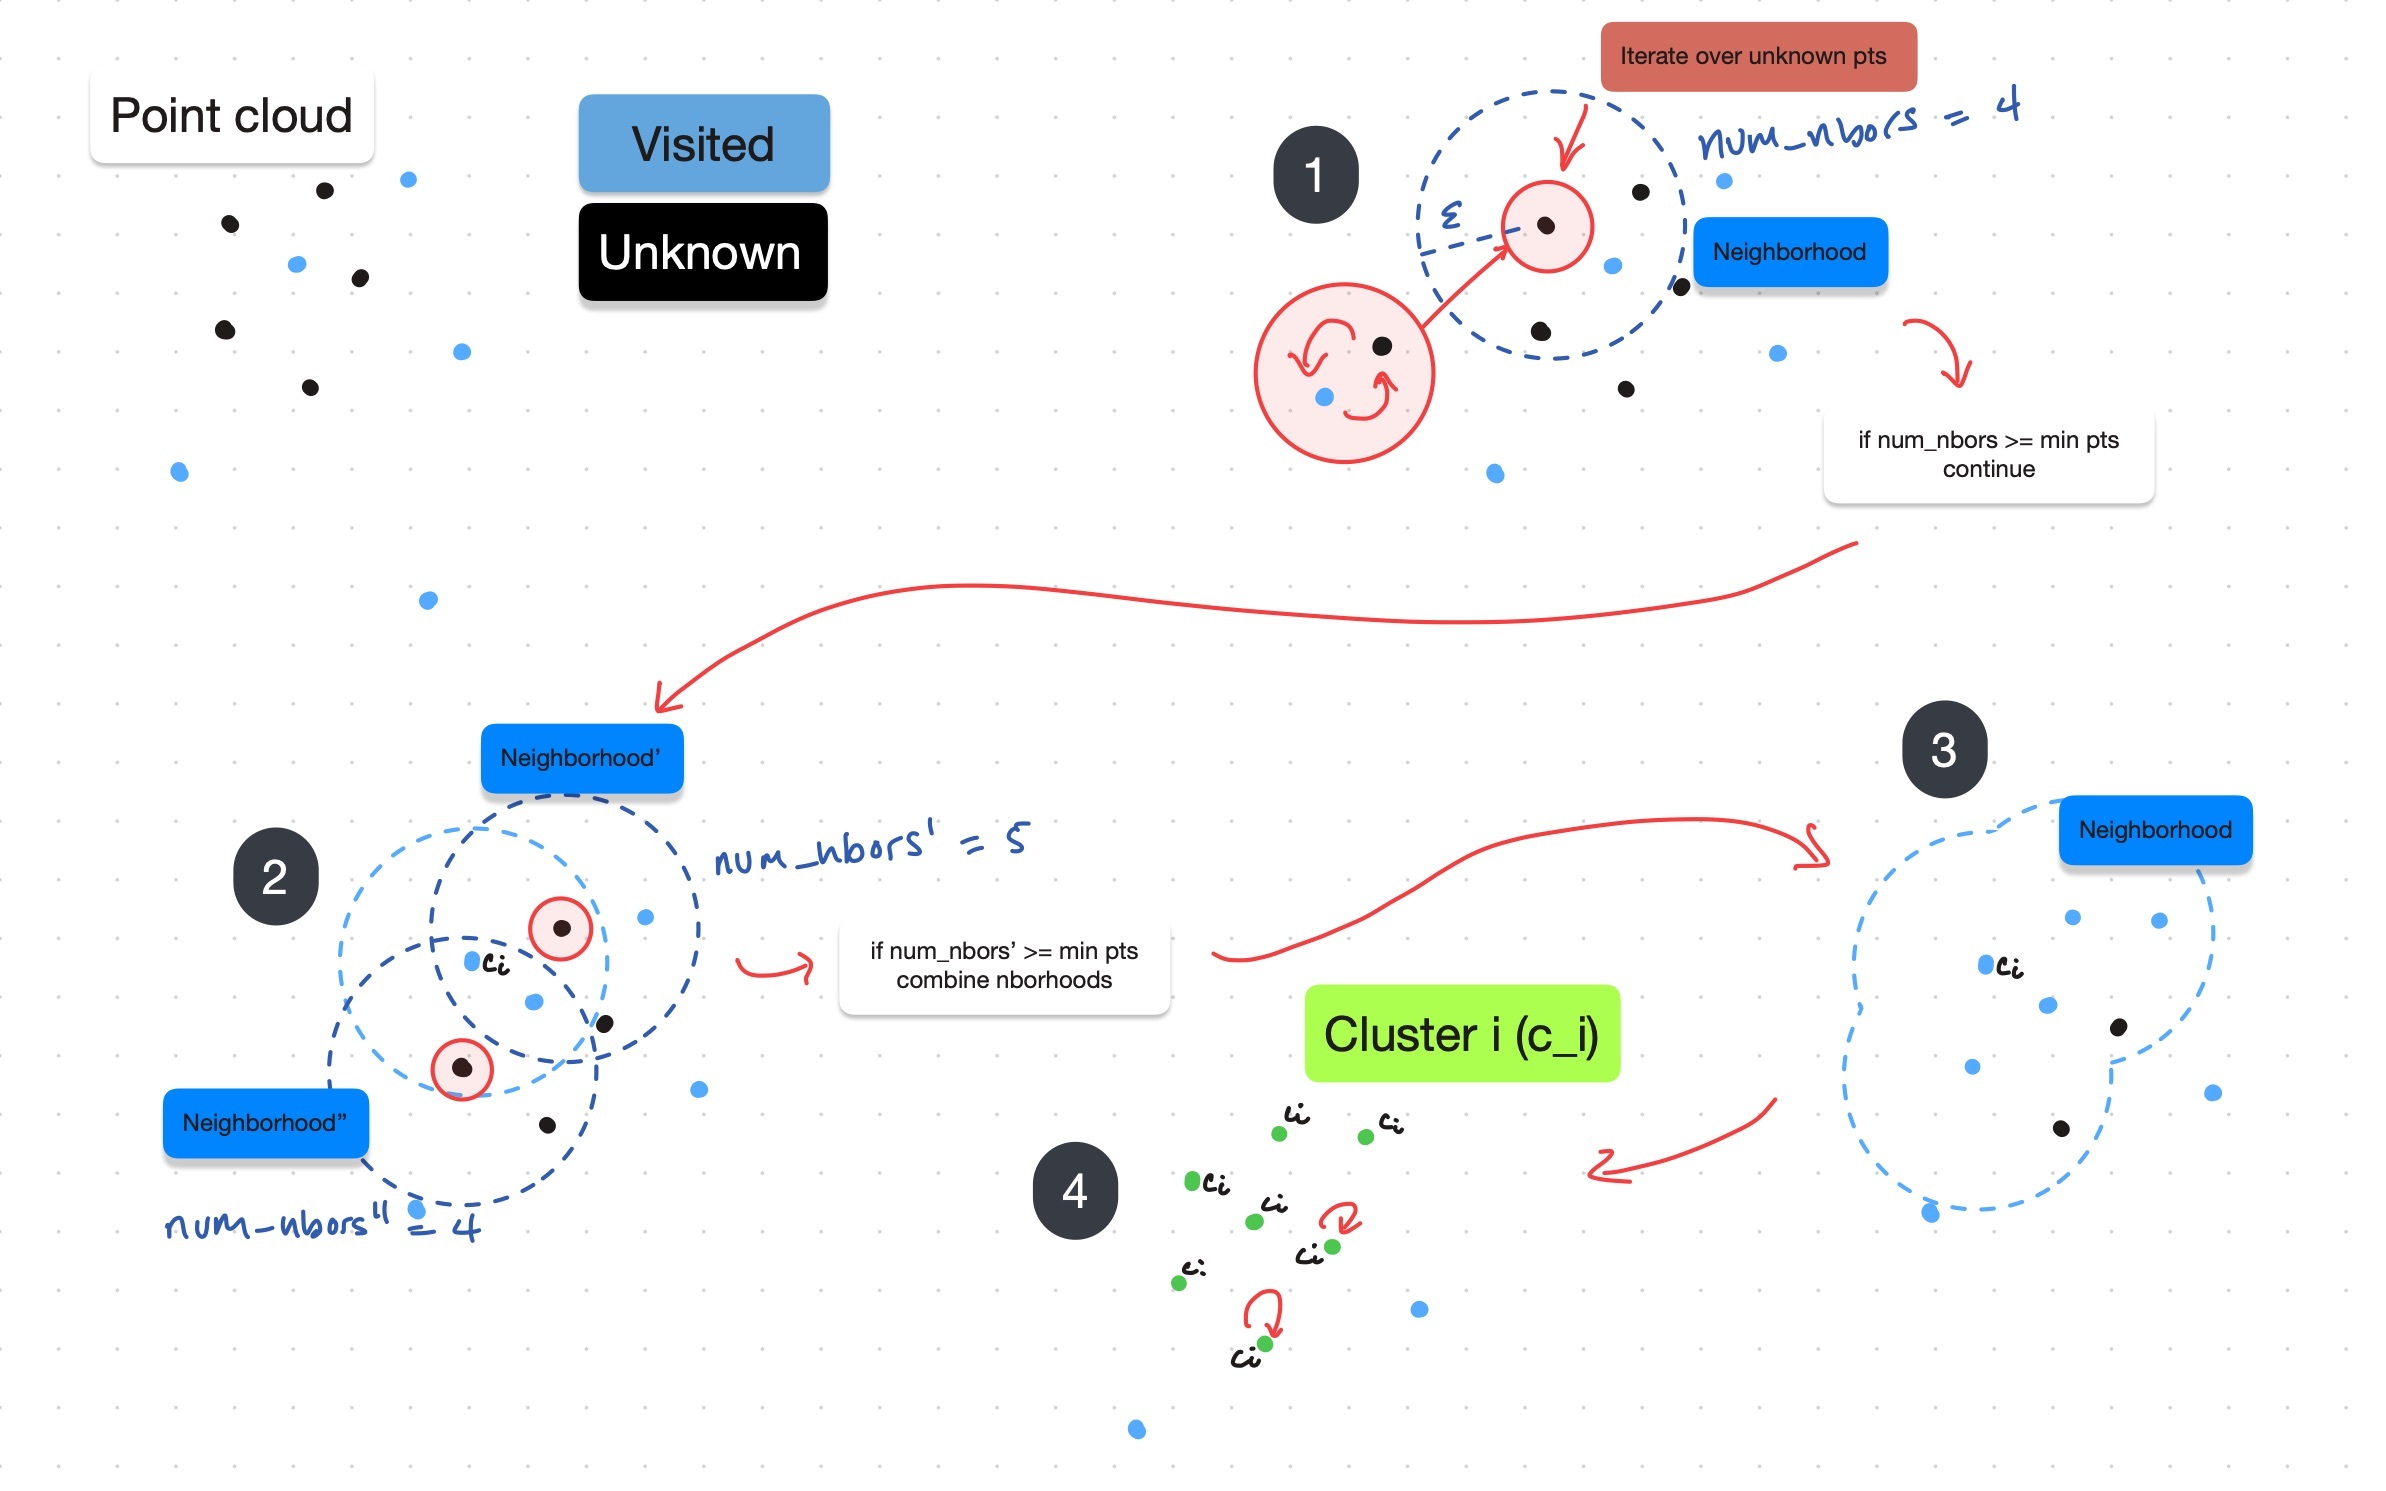
Diagram description of DBSCAN
for each point P in the filtered cloud do:

    if P already processed by loop, continue

    find all neighbors of P within an epsilon (ε)

    if number of points in neighborhood greater than min points do:
        label P as a cluster point

        recursively test if neighbors meet the same cluster criterion (see wiki linked below for full pseudocode)
    else:
        filter out
Notes
DBSCAN makes the assumption that all clusters of sufficient density left represent cones. Extraneous clusters are filtered in DBSCAN2 (see API Reference)